Using an IDE: The Features That Help You Code & Debug (OCR A-Level CS 2.2.1)
OCR A-Level CS 2.2.1: what an IDE is and the features that help you write and debug programs — editor, debugger, breakpoints, stepping, watches and more.

Free Using An IDE revision resources (OCR A-Level Computer Science, 2.2.1)
We’ve made exam-style practice for this exact topic, free to download: Using An IDE question sheet, mark scheme and cheat sheet. Grab them, have a go, then read the full guide below.
An IDE (Integrated Development Environment) brings all the tools a programmer needs into one place. Spec point 2.2.1(e) asks you to know the features an IDE provides to help write and debug a program — and Paper 2 reliably asks you to "describe three features of an IDE" (and sometimes to discuss the benefits in a 9-mark essay). Learn the features and what each one does for you, and these are easy marks.
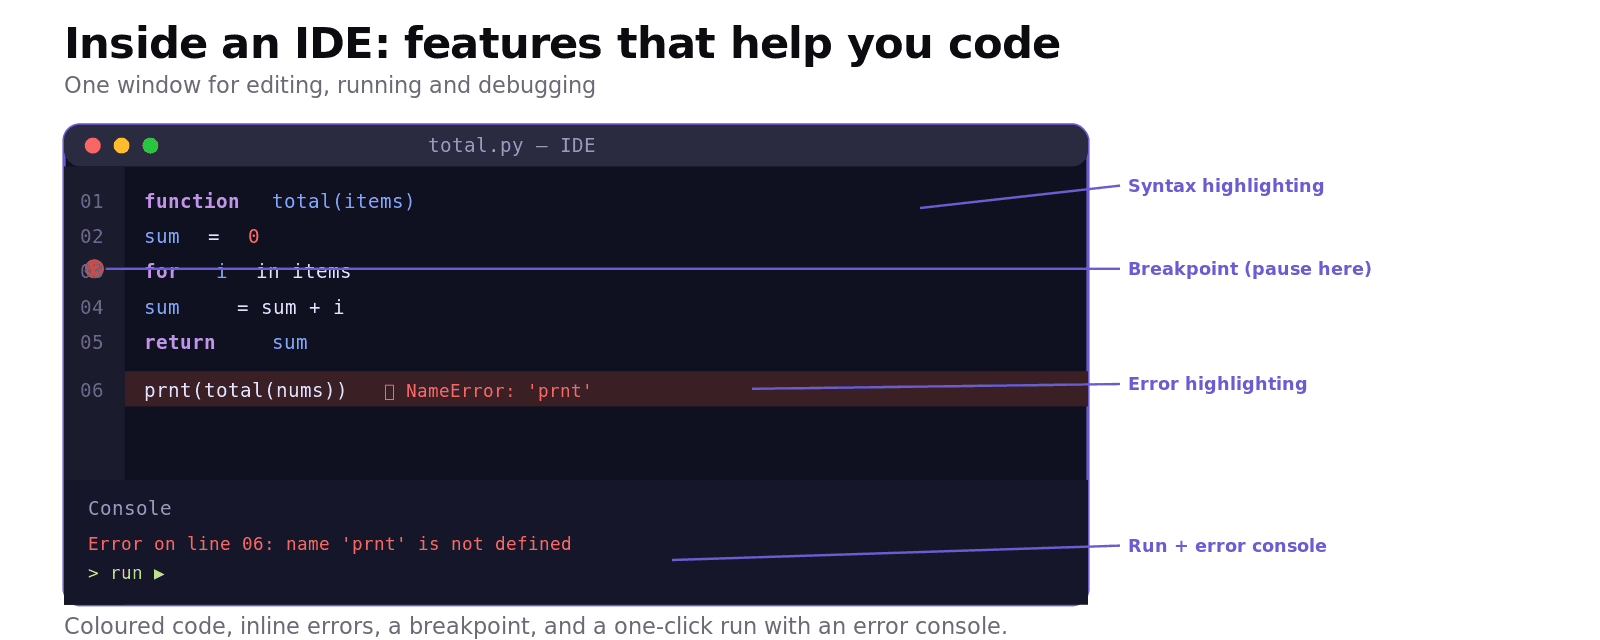
What an IDE is
An IDE is a single application that combines the tools for developing software — so you can write, run, test and debug a program without switching between separate programs. At minimum it includes a code editor, a way to run/translate the code, and debugging tools.
Popular IDEs include things like IDLE, Visual Studio, PyCharm and Eclipse — but for the exam you need the features, not the brand names.
Features that help you write code
These features speed up writing and reduce mistakes as you type:
Editor with syntax highlighting — colours keywords, strings and comments differently, so the structure is clear and typos stand out.
Auto-complete / auto-suggestion — offers to finish variable and function names, reducing typing and spelling errors.
Auto-indentation and formatting — lays out blocks neatly so the structure (loops, IFs) is easy to read.
Error highlighting — underlines syntax errors as you type, before you even run the program.
Code navigation / search — jump to a function definition, or find every use of a variable.
Features that help you debug
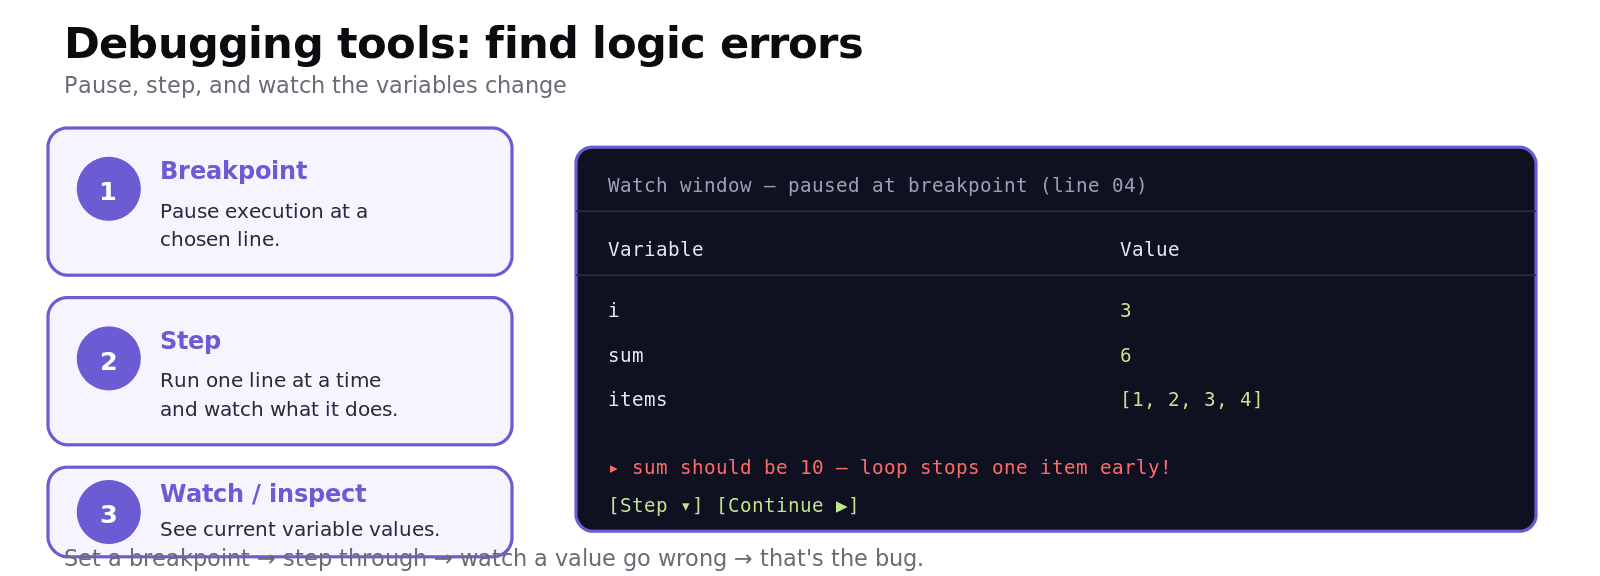
When a program runs but gives the wrong result (a logic error), the debugger helps you find out why:
Breakpoints — mark a line where execution should pause, so you can inspect the program's state at that point.
Stepping (step through) — run the program one line at a time, watching exactly what each line does.
Watch window / variable inspection — shows the current value of variables as you step, so you can see where one goes wrong.
Call stack view — shows which subroutines are currently active (useful for recursion).
A typical bug hunt: set a breakpoint just before the suspect code, step through line by line, and watch the variables until one holds an unexpected value — that's where the bug is.
Other helpful tools
A run-time environment / translator built in, so you can run the code with one click and see output immediately.
An error/output console that reports run-time errors with a message and line number.
Refactoring tools (e.g. rename a variable everywhere safely) and version-control integration on bigger IDEs.
Worked example: finding a logic error
A function is meant to total a list but returns one too few. In the IDE you'd: set a breakpoint on the loop, step through each pass, and use the watch window to track the running total and the loop counter. You spot that the loop stops one iteration early — a classic off-by-one. No print-statement guessing needed: the debugger's breakpoint, stepping and watch features took you straight to the fault. That's exactly the kind of benefit a "describe IDE features" question rewards.
Common exam mistakes
Naming a brand, not a feature. "Visual Studio" isn't a feature; breakpoints, syntax highlighting and stepping are.
Vague answers. Don't just say "it helps you debug" — say how (e.g. "a watch window shows variable values as you step").
Mixing up syntax and logic errors. Error highlighting catches syntax errors as you type; the debugger (breakpoints/stepping) helps with logic errors at run time.
Listing without describing. "Describe three features" wants the feature + what it does for the programmer, each.
One-sided IDE essays. A "discuss" can note small downsides too (IDEs are large, can be complex for beginners) before concluding.
Quick recap
An IDE combines the tools to write, run, test and debug a program in one application.
Writing aids: syntax highlighting, auto-complete, auto-indentation, error highlighting as you type.
Debugging aids: breakpoints (pause), stepping (line by line), watch window (variable values), call-stack view.
Plus a built-in translator/run button and an error console with line numbers.
In the exam: name the feature and say what it does for the programmer — not the brand.
Frequently asked questions
What is an IDE? An IDE, or Integrated Development Environment, is a single application that combines the tools a programmer needs to develop software — a code editor, a way to run or translate the code, and debugging tools — so they can write, run, test and debug a program without switching between separate programs.
What features of an IDE help you write code? Features that help write code include syntax highlighting, which colours keywords and strings to make structure clear; auto-complete, which suggests variable and function names; auto-indentation, which lays out blocks neatly; and error highlighting, which underlines syntax errors as you type, before the program is run.
What is a breakpoint? A breakpoint is a marker placed on a line of code that tells the debugger to pause execution when it reaches that line. Pausing lets the programmer inspect the values of variables and the program's state at that exact point, which helps locate logic errors.
What does stepping through code mean? Stepping through code means running the program one line at a time using the debugger, rather than all at once. As each line executes the programmer can watch what it does and how the variables change, making it easy to see exactly where the program behaves incorrectly.
What is a watch window? A watch window is a debugger feature that displays the current values of chosen variables while the program is paused or being stepped through. It lets the programmer see how each variable changes as the code runs, so they can spot the moment a value becomes wrong.
How does an IDE help with debugging? An IDE helps with debugging by providing a debugger with breakpoints to pause execution, stepping to run one line at a time, a watch window to inspect variable values, and an error console that reports run-time errors with line numbers. Together these let a programmer find logic errors without inserting print statements.